Box pruning revisited - part 3 - don’t trust the compiler
Part 3: don’t trust the compiler
We now look at the “CompleteBoxPruning” function for the first time. This is my code but since I wrote it 15 years ago, it’s pretty much the same for me as it is for you: I am looking at some foreign code I do not recognize much.
I suppose the first thing to do is to analyze it and get a feeling for what takes time. There is an allocation:
Then a loop to fill that buffer:
Then we sort this array:
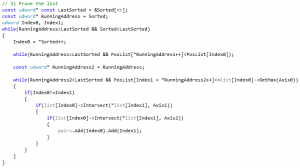
And then the rest of the code is the main pruning loop that scans the array and does overlap tests:
After that we just free the array we allocated, and return:
Ok, so, we can forget the allocation: allocations are bad and should be avoided if possible, but on PC, in single-threaded code like this, one allocation is unlikely to be an issue - unless not much else is happening. That leaves us with basically two parts: the sorting, and the pruning. I suppose this makes total sense for an algorithm usually called either “sweep-and-prune” or “sort-and-sweep” – the “box pruning” term being again just how I call this specific variation on the theme: single sorting axis, direct results, no persistent data.
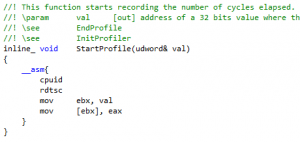
So first, let’s figure out how much time we spend in the sorting, and how much time in the pruning. We could use a profiler, or add extra rdtsc calls in there. Let’s try the rdtsc stuff. That would be an opportunity for me to tell you that the code in its current form will not compile for x64, because inline assembly is forbidden there. So the profiler functions for example do not compile:
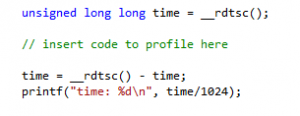
This is easy to fix though: these days there is a __rdtsc() intrinsic that you can use instead, after including <intrin.h>. Let’s try that here. You can include the header and write something like this around the code you want to measure:
If we apply this to the different sections of the code, we get the following results:
Allocation:
time: 3
time: 1
time: 1
time: 1
time: 1
time: 1
time: 1
time: 1
time: 1
time: 1
time: 1
time: 1
time: 1
time: 1
time: 1
time: 1
Remember that we looped several times over the “CompleteBoxPruning” function to get more stable results. Typically what happens then is that the first call is significantly more expensive than the other ones, because everything gets pulled in the cache (i.e. you get a lot more cache misses than usual). When optimizing a function, you need to decide if you want to optimize for the “best case”, the “average case”, or the “worst case”.
The best case is when everything is nicely in the cache, you don’t get much cache misses, and you can focus on things like decreasing the total number of instructions, using faster instructions, removing branches, using SIMD, etc.
The worst case is the first frame, when cache misses are unavoidable. To optimize this, you need to reduce the number of cache misses, i.e. decrease the size of your structures, use more cache-friendly access patterns, use prefetch calls judiciously, etc.
The average case is a fuzzy mix of both: in the real world you get a mixture of best & worst cases depending on what the app is doing, how often the function is called, etc, and at the end of the day, on average, everything matters. There is no right answer here, no hierarchy: although it is good practice to “optimize the worst case”, all of it can be equally important.
At this point the main thing is to be aware of these differences, and to know approximately if the optimization you’re working on will have an impact on the worst case or not. It is relatively common to work on a “best case” optimization that seems wonderful “in the lab”, in an isolated test app, and then realize that it doesn’t make any actual difference once put “in the field” (e.g. in a game), because the cost becomes dominated by cache misses there.
For now we are in the lab, so we will just be aware of these things, notice that the first frame is more expensive, and ignore it. If you think about it too much, you never even get started.
Sorting (static):
time: 686
time: 144
time: 139
time: 145
time: 138
time: 138
time: 138
time: 148
time: 139
time: 137
time: 138
time: 138
time: 137
time: 138
time: 146
time: 144
The sorting is at least 140 times more expensive than the allocation in our test. Thus, as expected, we’re just going to ignore the allocation for now. That was only a hunch before, but profiling confirms it was correct.
The first frame is almost 5 times more expensive than the subsequent frames, which seems a bit excessive. This comment explains why:
The code is using my old radix sort, which has a special trick to take advantage of temporal coherence. That is, if you keep sorting the same objects from one frame to the next, sometimes the resulting order will be the same. Think for example about particles being sorted along the view axis: their order is going to be roughly the same from one frame to the next, and that’s why e.g. a bubble-sort can work well in this case - it terminates early because there is not much work needed (or no work at all indeed) to get from the current ordering to the new ordering. The radix sort uses a similar idea: it starts sorting the input data using the sorted ranks from the previous call, then notices that the ranks are still valid (the order hasn’t changed), and immediately returns. So it actually skips all the radix passes. That’s why the first frame is so much more expensive: it’s the only frame actually doing the sorting!
To see the actual cost of sorting, we can remove the static keyword. That gives:
Sorting (non static):
time: 880
time: 467
time: 468
time: 471
time: 471
time: 470
time: 469
time: 469
time: 499
time: 471
time: 471
time: 490
time: 470
time: 471
time: 470
time: 469
That’s more like it. The first frame becomes more expensive for some reason (maybe because we now run the ctor/dtor inside that function, i.e. we allocate/deallocate memory), and then the subsequent frames reveal the real cost of radix-sorting the array. The first frame is now less than 2X slower, i.e. the cost of cache misses is not as high as we thought.
In any case, this is all irrelevant for now, because:
Pruning:
time: 93164
time: 94527
time: 95655
time: 93348
time: 94079
time: 93220
time: 93076
time: 94709
time: 93059
time: 92900
time: 93033
time: 94699
time: 94626
time: 94186
time: 92811
time: 95747
There it is. That’s what takes all the time. The noise (the variation) in the timings is already more expensive than the full non-static radix sorting. So we will just put back the static sorter and ignore it entirely for now. In this test, questions like “is radix sort the best choice here?” or “shouldn’t you use quick-sort instead?” are entirely irrelevant. At least for now, with that many boxes, and in this configuration (the conclusion might be different with less boxes, or with boxes that do not overlap each-other that much, etc), the sorting costs nothing compared to the pruning.
And then we can look at the last part:
Deallocation:
time: 4
time: 3
time: 3
time: 3
time: 6
time: 3
time: 3
time: 3
time: 3
time: 3
time: 3
time: 3
time: 3
time: 3
time: 3
time: 3
Nothing to see here, it is interesting to note that the deallocation is more expensive than the allocation, but this is virtually free anyway.
So, analysis is done: we need to attack the pruning loop, everything else can wait.
Let’s look at the loop again:
There isn’t much code but since we have a lot of objects (10000), any little gain from any tiny optimization will also be multiplied by 10000 - and become measurable, if not significant.
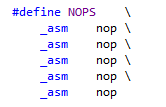
If you look at the C++ code and you have no idea, you can often switch to the disassembly in search of inspiration. To make it more readable, I often use a NOP macro like this one:
And then I wrap the code I want to inspect between nops, like this for example:
It allows me to isolate the code in the assembly, which makes it a lot easier to read:
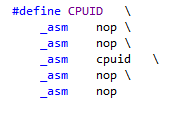
Note that the nops don’t prevent the compiler from reorganizing the instructions anyway, and sometimes an instruction you want to monitor can still move outside of the wrapped snippet. In this case you can use the alternative CPUID macro which puts a serializing cpuid instruction in the middle of the nops:
It puts more restrictions on generated code and makes it easier to analyze, but it also makes things very slow - in our case here it makes the optimized loop slower than the brute-force loop. It also sometimes changes the code too much compared to what it would be “for real”, so I usually just stick with nops, unless something looks a bit fishy and I want to double-check what is really happening.
Now, let’s look at the disassembly we got there.
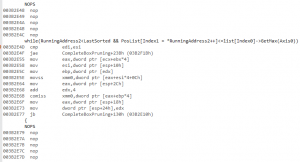
While decorating the code with nops does not make everything magically obvious, there are still parts that are pretty clear right from the start: the cmp/jae is the first comparison (”while(RunningAddress2<LastSorted”) and the comiss/jb is the second one (”&& PosList[Index1 = *RunningAddress2++]<=list[Index0]->GetMax(Axis0))”).
Now the weird bit is that we first read something from memory and put it in xmm0 (”movss xmm0,dword ptr [eax+esi*4+0Ch]“), and then we compare this to some other value we read from memory (”comiss xmm0,dword ptr [eax+ebp*4]“). But in the C++ code, “list[Index0]->GetMax(Axis0)” is actually a constant for the whole loop. So why do we read it over and over from memory? It seems to me that the first movss is doing the “list[Index0]->GetMax(Axis0)”. It’s kind of obvious from the 0Ch offset in the indexing: we’re reading a “Max” value from the bounds, they start at offset 12 (since the mins are located first and they’re 4 bytes each), so that 0Ch must be related to it. And thus, it looks like the compiler decided to read that stuff from memory all the time instead of keeping it in a register.
Why? It might have something to do with aliasing. The pointers are not marked as restricted so maybe the compiler detected that there was a possibility for “list” to be modified within the loop, and thus for that limit value to change from one loop iteration to the next. Or maybe it is because “Index0″ and “Axis0″ are not const.
Or something else.
I briefly tried to use restricted pointers, to add const, to help the compiler see the light.
I failed.
At the end of the day, the same old advice remained: don’t trust the compiler. Never ever assume that it’s going to “see” the obvious. And even if yours does, there is no guarantee that another compiler on another platform will be as smart.
To be fair with compilers, they may actually be too smart. They might see something we don’t. They might see a perfectly valid (yet obscure and arcane) reason that prevents them from doing the optimization themselves.
In any case whatever the reason we reach the same conclusion: don’t rely on the compiler. Don’t assume the compiler will do it for you. Do it yourself. Write it this way:
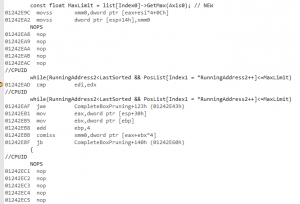
And suddenly the disassembly makes sense:
The load with the +0Ch is now done before the loop, and the code between the nops became smaller. It is not perfect still: do you see the line that writes xmm0 to the stack ? (”movss dword ptr [esp+14h],xmm0″). You find it again a bit later like this:
So the compiler avoids the per-loop computation of MaxLimit (yay!) but instead of keeping it in one of the unused XMM registers (there are plenty: the code only uses one at this point), it writes it once to the stack and then reloads it from there, all the time (booh!).
Still, that’s enough for now. By moving the constant “MinLimit” and “MaxLimit” values out of the loops, in explicit const float local variables, we get the following timings:
Office PC:
Complete test (brute force): found 11811 intersections in 819967 K-cycles.
89037 K-cycles.
98463 K-cycles.
95177 K-cycles.
88952 K-cycles.
89091 K-cycles.
88540 K-cycles.
89151 K-cycles.
91734 K-cycles.
88352 K-cycles.
88395 K-cycles.
99091 K-cycles.
99361 K-cycles.
91971 K-cycles.
89706 K-cycles.
88949 K-cycles.
89276 K-cycles.
Complete test (box pruning): found 11811 intersections in 88352 K-cycles.
Home PC:
Complete test (brute force): found 11811 intersections in 781863 K-cycles.
96888 K-cycles.
93316 K-cycles.
93168 K-cycles.
93235 K-cycles.
93242 K-cycles.
93720 K-cycles.
93199 K-cycles.
93725 K-cycles.
93145 K-cycles.
93488 K-cycles.
93390 K-cycles.
93346 K-cycles.
93138 K-cycles.
93404 K-cycles.
93268 K-cycles.
93335 K-cycles.
Complete test (box pruning): found 11811 intersections in 93138 K-cycles.
The gains are summarized here:
|
Home PC |
Timings (K-Cycles) |
Delta (K-Cycles) |
Speedup |
Overall X factor |
|
(Version1) |
(101662) |
|
|
|
|
Version2 - base |
98822 |
0 |
0% |
1.0 |
|
Version3 |
93138 |
~5600 |
~5% |
~1.06 |
|
Office PC |
Timings (K-Cycles) |
Delta (K-Cycles) |
Speedup |
Overall X factor |
|
(Version1) |
(96203) |
|
|
|
|
Version2 - base |
92885 |
0 |
0% |
1.0 |
|
Version3 |
88352 |
~4500 |
~5% |
~1.05 |
“Delta” and “Speedup” are computed between current version and previous version. “Overall X factor” is computed between current version and the base version (version 2).
The base version is version2 to be fair, since version1 was the same code, just not using the proper compiler settings.
The code became faster. On the other hand the total number of instructions increased to 198. This is slightly irrelevant though: some dummy instructions are sometimes added just to align loops on 16-byte boundaries, reducing the number of instructions does not always make things faster, all instructions do not have the same cost (so multiple cheap instructions can be faster than one costly instruction), etc. It is however a good idea to keep an eye on the disassembly, and the number of instructions used in the inner loop still gives a hint about the current state of things, how much potential gains there are out there, whether an optimization had any effect on the generated code, and so on.
What we learnt:
Don’t trust the compiler.
Don’t assume it’s going to do it for you. Do it yourself if you can.
Always check the disassembly.
That’s enough for one post.
Next time we will stay focused on these ‘while’ lines and optimize them further.

