Box pruning revisited - part 14b - Ryg rolling
Part 14b – Ryg rolling
After I wrote about this project on Twitter, Fabian “Ryg” Giesen picked it up and made it his own. For those who don’t know him, Fabian works for RAD Game Tools and used to be / still is a member of Farbrausch. In other words, we share the same demo-scene roots. And thus, it is probably not a surprise that he began hacking the box-pruning project after I posted version 12 (the assembly version).
Now, at the end of part 14a we thought we could still improve the unrolled code by taking advantage of the address calculation to get rid of some more instructions. As it turns out, Fabian’s code does that already.
And much more.
Since he was kind enough to write some notes about the whole thing, I will just copy-paste his own explanations here. This is based on my assembly version (i.e. box pruning version 12), and this is just his initial attempt at optimizing it. He did a lot more than this afterwards. But let’s do one thing at a time here.
In his own words:
—-
Brief explanation what I did to get the speed-up, and the thought process behind it.
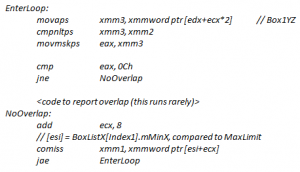
The original code went:
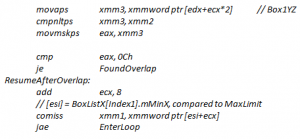
My first suggestion was to restructure the loop slightly so the hot “no overlap” path is straight-line and the cold “found overlap” path has the extra jumps. This can help instruction fetch behavior, although in this case it didn’t make a difference. Nevertheless, I’ll do it here because it makes things easier to follow:
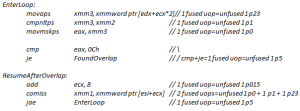
Alright, so that’s a nice, sweet, simple loop. Now a lot of people will tell you that out-of-order cores are hard to optimize for since they’re “unpredictable” or “fuzzy” or whatever. I disagree: optimizing for out-of-order cores is *easy* and far less tedious than say manual scheduling for in-order machines is. It’s true that for OoO, you can’t just give a fixed “clock cycles per iteration” number, but the same thing is already true for *anything* with a cache, so who are we kidding? The reality of the situation is that while predicting the exact flow uops are gonna take through the machine is hard (and also fairly pointless unless you’re trying to build an exact pipeline simulator), quantifying the overall statistical behavior of loops on OoO cores is often easier than it is for in-order machines. Because for nice simple loops like this, it boils down to operation counting - total number of instructions, and total amount of work going to different types of functional units. We don’t need to worry about scheduling; the cores can take care of that themselves, and the loop above has no tricky data dependencies between iterations (the only inter-iteration change is the “add ecx, 8″, which doesn’t depend on anything else in the loop) so everything is gonna work fine on that front. So, on to the counting. I’m counting two things here: 1. “fused domain” uops (to a first-order approximation, this means “instructions as broken down by the CPU front-end”) and 2. un-fused uops going to specific groups of functional units (”ports”), which is what the CPU back-end deals with. When I write “unfused p0″, I mean an unfused uop that has to go to port 0. “unfused 1 p23″ is an unfused uop that can go to ports 2 or 3 (whichever happens to be free). I’m using stats for the i7-2600K in my machine (Intel Sandy Bridge); newer CPUs have slightly different (but still similar) breakdowns. Now without further ado, we have:
(yes, the pair of x86 instructions cmp+je combines into one fused uop.)
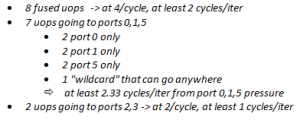
Fused uops are the currency the CPU frontend deals in. It can process at most 4 of these per cycle, under ideal conditions, although in practice (for various reasons) it’s generally hard to average much more than 3 fused uops/cycle unless the loop is relatively short (which, luckily, this one is). All the ports can accept one instruction per cycle.
So total, we have:
And of that total, the actual box pruning test (the first 5 x86 instructions) are 4 fused uops, 3 unfused p015 and 1 unfused p23 - a single cycle’s worth of work. In other words, we spend more than half of our execution bandwidth on loop overhead. That’s no good.
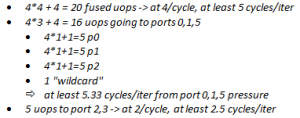
Hence, unroll 4x. With that, provided there *are* at least 4 boxes to test against in the current cluster, we end up with:
Our bottleneck are once again ports 0,1,5, but they now process 4 candidate pairs in 5.33 cycles worth of work, whereas they took 9.33 cycles worth of work before. So from that analysis, we expect something like a 42.8% reduction in execution time, theoretical. Actual observed reduction was 34.4% on my home i7-2600K (12038 Kcyc -> 7893 Kcyc) and 42.9% on my work i7-3770S (8990 Kcyc -> 5131 Kcyc). So the Sandy Bridge i7-2600K also runs into some other limits not accounted for in this (very simplistic!) analysis whereas the i7-3770S behaves *exactly* as predicted.
The other tweak I tried later was to switch things around so the box X coordinates are converted to integers. The issue is our 2-fused-uop COMISS, which we’d like to replace with a 1-fused-uop compare. Not only is the integer version fewer uops, the CMP uop is also p015 instead of the more constrained p0+p1 for COMISS.
What would we expect from that? Our new totals are:
From the back-of-the-envelope estimate, we now go from purely backend limited to simultaneously backend and frontend limited, and we’d expect to go from about 5.33 cycles/iter to 5 cycles/iter, for a 6.2% reduction.
And indeed, on my work i7-3770S, this change gets us from 5131 Kcyc -> 4762 Kcyc, reducing the cycle count by 7.2%. Close enough, and actually a bit better than expected!
This example happens to work out very nicely (since it has a lot of arithmetic and few branch mispredictions or cache misses), but the same general ideas apply elsewhere. Who says that out-of-order cores are so hard to predict?
—-
Right. Thank you Fabian. That was certainly a… rigorous explanation.
Here are a few comments that come to mind:
- It is certainly true that manually pairing the assembly code for the U and V pipelines of the first Pentiums (which I did a lot in the past) was far more tedious than letting the out-of-order processors deal with it for me.
- It boils down to operation counting indeed. That’s what we noticed in the previous posts: reducing the total number of instructions has a measurable impact on performance in this case.
- I did try to restructure the loop to remove the jump from the hot path, but as you noticed as well it didn’t make any difference. But as a side-effect of another goal (reducing the size of the main loop), the hot path became jump-free in version 14a anyway.
- Using integers is what we tried in version 7 already. While we did measure gains, they were too small to matter and we ignored them. That being said, version 7 took 40000+ KCycles… so the gains might have been small compared to the total cost at the time, but if we still get the same gains today it might be a different story. In other words, going from 5131 to 4762 K-Cycles is just a 369 K-Cycles gain: peanuts compared to 40000, but probably worth it compared to 4000. And yes, using integers for X’s only may also be a better idea than using them for everything. So we will revisit this and see what happens in the C++ version.
In any case, here are the timings for Ryg’s version on my machines:
|
Home PC |
Timings (K-Cycles) |
Delta (K-Cycles) |
Speedup |
Overall X factor |
|
Version2 - base |
98822 |
0 |
0% |
1.0 |
|
… |
… |
… |
… |
… |
|
(Version12 – 2nd) |
(11731) |
(~2600) |
(~18%) |
(~8.42) |
|
Version14a - VERSION3 |
9012 |
~3200 |
~26% |
~10.96 |
|
Version14b – Ryg/Unsafe |
7600 |
~4100 |
~35% |
~13.00 |
|
Office PC |
Timings (K-Cycles) |
Delta (K-Cycles) |
Speedup |
Overall X factor |
|
Version2 - base |
92885 |
0 |
0% |
1.0 |
|
… |
… |
… |
… |
… |
|
(Version12 – 2nd) |
(10014) |
(~2500) |
(~20%) |
(~9.27) |
|
Version14a - VERSION3 |
8532 |
~1500 |
~15% |
~10.88 |
|
Version14b – Ryg/Unsafe |
7641 |
~2300 |
~23% |
~12.15 |
The Delta and Speedup columns are computed between Ryg’s version and the previous best assembly version. The Timings and Overall X factor columns are absolute values that you can use to compare Ryg’s version to our initial C++ unrolled version (14a). The comparisons are not entirely apple-to-apple:
- Versions 12 and 14b are “unsafe”, version 14a is “safe”.
- Versions 12 and 14b are assembly, version 14a is C++.
- Version 14b does more than unrolling the loop, it also switches some floats to integers.
So the comparisons might not be entirely “fair” but it doesn’t matter: they give a good idea of what kind of performance we can achieve in “ideal” conditions where the compiler doesn’t get in the way.
It gives a target performance number to reach.
And that’s perfect really because we just reached our previous performance target (10x!) in the previous post.
So we need a new one. Perfect timing to send me new timings.
Well, gentlemen, here it is: our new goal is to reach the same performance as Ryg’s unrolled assembly version, but using only C++ / intrinsics – to keep things somewhat portable.
This is what we will try to do next time.
Stay tuned!
What we learnt:
It is always a good idea to make your code public and publish your results. More often than not you get good feedback and learn new things in return. Sometimes you even learn how to make your code go faster.
Ex-scene coders rule. (Well we knew that already, didn’t we?)
