The evolution of PhysX (5/12) - Rigid bodies (compounds)

May 11th, 2013

We have been using simple shapes so far but many game objects are actually compounds, made of multiple sub-shapes. Let’s investigate stacks & piles for these.

—-

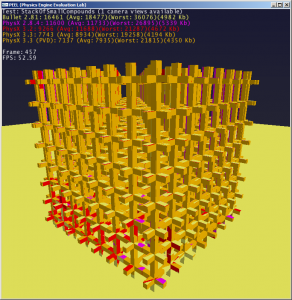
The first scene (“StackOfSmallCompounds”) is as follows:

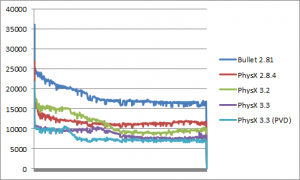
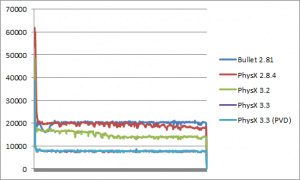
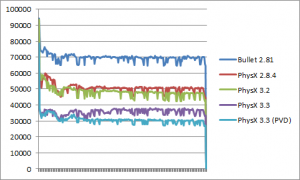
For the first time, we see a small regression between 2.8.4 and 3.2, but it only happens for the first part of the curve. After that, 3.2 takes over and becomes faster than 2.8.4, as it should be. Overall each PhysX version is faster than the one before, but not by much.

Bullet is again up to 2X slower than 3.3. Not much to say about that one.

—-

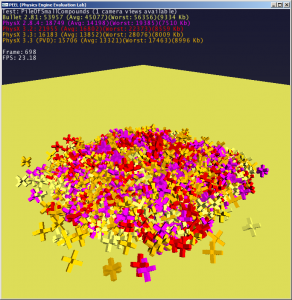
The second scene (“PileOfSmallCompounds”) is much more surprising.

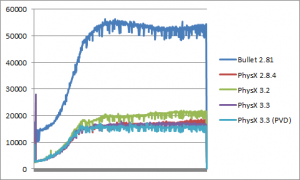
3.2 is now clearly slower than 2.8.4. That’s the first clear regression seen in these tests so far. It’s not a lot slower, but the graph is very clear, and it is wrong. Luckily things seem to have been fixed between 3.2 and 3.3, which became faster again. If we except this 3.2 anomaly, all PhysX versions are pretty similar here.

Now Bullet on the other hand is a mystery. It really doesn’t like this scene, and overall it is about 3X slower than PhysX. No idea why. This one is a bit surprising.

The evolution of PhysX (4/12) - Rigid bodies (piles)

May 11th, 2013

Stacks are fun, but games mainly need piles. For example piles of falling debris when you shoot things up. What you usually look for is an engine that can simulate piles without jittering, or wobbling objects. Fortunately all the engines involved here do a good job in that respect, and we can just look at the performance side of things.

—-

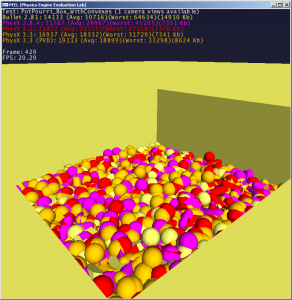
The first scene (“PotPourri_Box_WithConvexes”) is a simple box container filled with boxes, spheres, capsules and convexes.

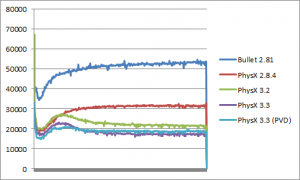
Each PhysX version is faster than the one before. Checked. PhysX 3.3 is about 2X faster than PhysX 2.8.4.

PCM does not seem to help much in this case. And in fact Bullet is significantly slower than all PhysX versions here.

Also, for some reason Bullet is now the one consuming about 2X more memory than the others – while it was quite good memory-wise before. Curious.

—-

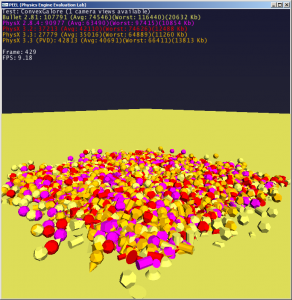
The second scene (“ConvexGalore”) is a pile of falling convexes, of various shapes and complexities.

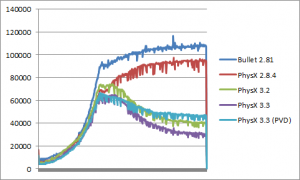
The profile curves were kind of flat so far but this is now changing. The initial part of the curves, while the objects are falling down without touching each other, look remarkably similar in all engines. But then things diverge and 2 trends emerge: for some engines (Bullet, 2.8.4) the curve keeps growing (i.e. performance becomes worse and worse), while for other engines (PhysX 3.x) the curve goes down and performance increases.

Overall each PhysX version is faster than the previous one. Checked.

PCM in 3.3 is ultimately slower than regular contact generation in this case.

Again, Bullet seems to suffer both in terms of performance and memory usage.

—-

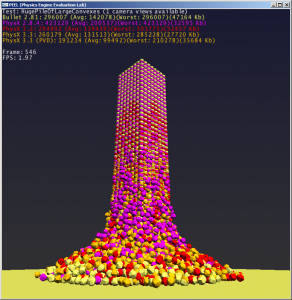
The third scene (“HugePileOfLargeConvexes”) is a stress test containing more than 5000 large convexes falling on each other.

As usual, each PhysX version is faster than the previous one. Checked.

The graph shows 3 clear things:

  • 2.8.4 is significantly slower than the others
  • 3.3 / PCM is significantly faster than the others
  • The remaining engines are otherwise very close to each-other, performance-wise.

Since we are using large convexes, it is expected that PCM works better than SAT here. With so many objects falling vertically, other subsystems like the broadphase might have a stronger impact on performance than in the other scenes.

In any case, no big surprise in this one.

The evolution of PhysX (3/12) - Rigid bodies (convex stacks)

May 11th, 2013

We continue with stacks, this time stacks of convex objects. This is where things start to become interesting. There are multiple things to be aware of here:

  • Regular contact generation between boxes is a lot easier (and a lot cheaper) than contact generation between convexes. So PCM-based engines should take the lead here in theory.
  • But performance depends a lot on the complexity of the convex objects as well.
  • It also depends whether the engine uses a “contact cache” or not.

Overall it’s rather hard to predict. So let’s see what we get.

We have two scenes here, for “small” and “large” convexes. Small convexes have few vertices, large convexes have a lot of vertices. The number of vertices has a high impact on performance, especially for engines using SAT-based contact generation.

—-

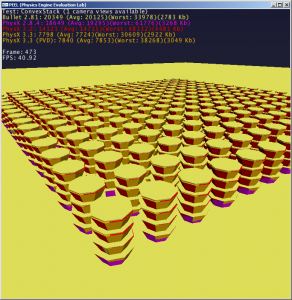
The first scene (“ConvexStack”) uses the small convexes. Each PhysX version is again a bit faster than the previous one, so that’s good, that’s what we want.

There doesn’t seem to be any speed difference between PCM and regular contact generation. In fact PCM has even a slightly worse worst case – maybe the overhead of managing the persistent manifolds. I suppose it shows that SAT-based contact generation is a viable algorithm for small convexes, which is something we knew intuitively.

Now, 3.3 is about 2X faster than 3.2 on average, even when they both use SAT. The perf difference here probably comes from two things: 3.3 uses extra optimizations like “internal objects” (this probably explains the better worst case) and it also uses a “contact cache” to avoid regenerating all contacts all the time (this probably explains the better average case).

As for 2.8.4 and Bullet, they’re of similar speed overall, and both are significantly slower than 3.3. We see that 2.8.4 has the worst worst case of all, which is probably due to the old SAT-based contact generation used there – it lacked a lot of the optimizations we introduced later.

As for box stacks the initial frame is a lot more expensive than subsequent frames. Contrary to box stacks though, I think a lot of it is due to the initial contact generation. Engines sometimes use temporal coherence to cache various data from one frame to the next, and that’s why the first contact generation pass is more expensive. It should be pretty clear on a scene like this, where all objects are generating their initial contacts in the same frame, and then they don’t move much anymore. This is not a very natural scenario (most games use “piles” of debris rather than “stacks” of debris), but those artificial scenes are handy to check your worst case.

—-

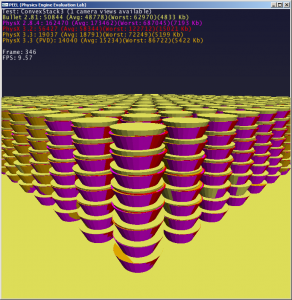
The second scene (“ConvexStack3”) uses large convexes. Now look at that! Very interesting stuff here.

Each PhysX version is again faster than the previous one, that’s good. But the differences are massive now, with PhysX 3.3 an order of magnitude faster than PhysX 2.8.4. And also almost 3X faster than 3.2. Well it’s nice to see that our efforts paid off.

In terms of PCM vs SAT, it seems pretty clear that PCM gives better performance for large convexes. We see this with PhysX 3.3, but also very clearly with Bullet. It is the first time so far that Bullet manages to be faster than PhysX. It is not really a big surprise: SAT is not a great algorithm for large convexes, we knew that.

On the other hand what we didn’t know is how much slower 2.8.4 could be, compared to the others. I think it is time to upgrade to PhysX 3.3 if you are using large convexes.

Another thing to mention is the memory usage for 3.2. We saw this trend before, and it seems to be worse in this scene: 3.2 is using more memory than it should. The issue has been fixed in 3.3 though.

The evolution of PhysX (2/12) - Rigid bodies (box stacks)

May 11th, 2013

So let’s start with some basic rigid body simulation: stacks, piles, and mesh collisions. There are two versions of PhysX 3.3 included in these rigid body tests: one using the regular contact generation, and one using the “PCM” method, introduced in 3.3. PCM stands for Persistent Contact Manifold and this algorithm builds contact manifolds iteratively, over several frames. The regular contact generation, on the other hand, builds a full manifold each frame. Both algorithms have pros & cons. Note that as far as I know, both Bullet and Havok have been using the PCM approach for a long time. Anyway the PhysX 3.3 version using PCM is the one marked with “(PVD)” (for completely uninteresting reasons that are too long to explain).

(Click on each screenshot to enlarge them)

—-

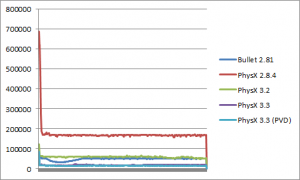
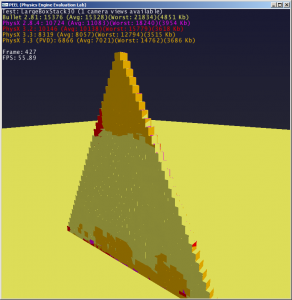
The first scene (“LargeBoxStack30”) is a classical box stack, with a 30-boxes-large base. This isn’t terribly useful per-se in a game, but this is a standard test for stability and performance of physics engines.

I am only testing fairly mature engines here so there is little surprise: they all handle this quite well. In terms of performance we see that each successive version of PhyX is a little bit faster than the previous one, which is what we ideally expect to see in all tests. Bullet gives decent results but remains slower than all PhysX versions - and in particular up to 2X slower than PhysX 3.3/PCM.

Nothing very interesting yet in terms of memory usage, all libraries are close, which is expected for such a simple scene.

If you look at the graph closely you will see that a whole bunch of things seem to happen in the first frame, which takes significantly more time to execute than subsequent frames. This is due both to cache effects (nothing is in the cache the first time), and mainly to the initial creation of various scene-related structures (broadphase, etc). This concerns all engines and it only affects the first simulation frame, so we can ignore them in this case.

One interesting thing to note is that this box stack eventually collapses after a certain time, for all engines except PhysX 2.8.4. This is not because PhysX 2.8.4 has more stable algorithms. This is only because it uses the “adaptive force” feature, which was a rather crude hack we used to increase the stability of stacks. It is still available in PhysX 3.x, but we found out it created various side-effects in various cases. Since large stacks aren’t very common in games, we just disabled this feature by default.

Finally, it is worth noting that we have several R&D projects in the pipe, making this stack (and much larger ones) completely stable. I may release a small proof-of-concept demo later, it’s good stuff.

—-

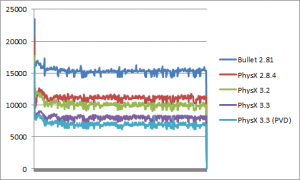
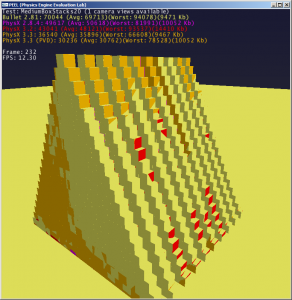
The second scene (“MediumBoxStacks20”) is quite similar, there are now 10 stacks, each of them with a 20-boxes-large base.

Contrary to the larger stack seen before, those stacks don’t collapse in any of the involved engines. Compared to the first one, this test captures performance issues in engines that have a high per-simulation island cost (since there are 10 islands here instead of 1). This does not actually affect any of the engines tested here though, and the profile and performance ratios for this test look similar to the first one. No big surprise there but one must always double-check instead of assuming, right?

In terms of memory usage, we see that PhysX 3.2 is less efficient than the other engines, but the numbers look quite similar otherwise. Comparing memory usage is not always easy since some engines may pre-allocate various buffers to avoid runtime memory allocations, producing an artificially high memory usage number – i.e. they allocate memory that they do not actually need yet. In any case the numbers are roughly similar here. No big winner.

The evolution of PhysX (1/12) - PEEL

May 11th, 2013

PEEL is a tool designed to evaluate, compare and benchmark physics engines - it’s “PEEL” for “Physics Engine Evaluation Lab”.

In a way, it is very similar to the old PAL project (Physics Abstraction Layer). But PEEL supports several things that were missing from PAL.

It was initially written to compare PhysX versions between each-other, and catch performance regressions. One of the recurrent questions we got about PhysX 3.x was “how much faster is it than 2.x?”. PEEL was originally built to easily answer this question. However it quickly became clear that adding support for entirely different engines was easy. And so, I did just that.

There is a virtual interface called “PINT” (for Physics INTerface), and an implementation of this interface for each physics engine. A number of tests (more than 250 so far) have been written, and they all talk to this interface. As a result, the same test can run on an arbitrary number of physics engines, as long as they properly implement the interface. This can also be used as a complement to PhysX’ migration guide, for people porting 2.x apps to 3.x: you can just look up how the interface is implemented in both.

At time of writing, PEEL supports:

  • Bullet 2.79
  • Bullet 2.81
  • Havok 6.6.0
  • Havok 2011_3_0
  • Havok 2011_3_1
  • Havok 2012_1_0
  • Havok 2012_2_0
  • ICE Physics
  • NovodeX 2.1.1
  • Opcode 1.3
  • Opcode 2.0
  • PhysX 2.8.4
  • PhysX 3.1
  • PhysX 3.2
  • PhysX 3.3 (various branches of it)
  • GRB (GPU rigid bodies)

PEEL uses all those physics engines and collision libraries in the same application. This was in itself quite an interesting engineering challenge, since you can’t just link to different versions of the same engine without running into compile and/or link errors about ambiguous or redundant symbols, function names, etc. Namespaces don’t really help when different versions of the same lib use the same namespace - or have the same DLL names, for that matter.

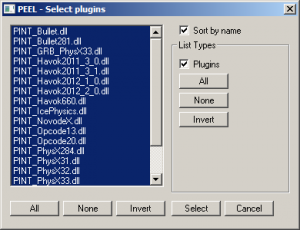
To make this work, each engine ended up in its own PEEL-related DLL (containing the implementation of the PINT interface), and each of these “PINT DLLs” is a plug-in for the PEEL application (reminiscent of the format plug-ins from Flexporter, same story).

For physics engines providing static libs, like Bullet, the whole Bullet-related code ends up in a PINT DLL, and that’s it.

For physics engines providing their own DLLs, like PhysX, the PhysX PINT wrapper ends up in a PINT DLL, which in turn loads the PhysX DLLs. Delay loading is used to be able to rename the PhysX DLLs, e.g. in order for the PhysX 3.2 and PhysX 3.3 DLLs to have different names.

The tests cover a wide range of features. There are API tests to just check how the basic API works. There are performance tests. There are behavior tests. There are tests for rigid body scenes, joints, CCD, raycasts, sweep tests, overlap tests, memory usage, for corner cases or degenerate cases, for multi-threaded or single-threaded simulations, etc. There is even a raytracing test rendering the scene from the current camera viewpoint, using the engines’ raycasting functions. This is what I meant above when I said that PEEL supported more things than PAL.

An interesting feature is that all engines run at the same time. All simulations are performed for all selected engines, in the same PEEL frame. Results are rendered on screen with a different color for each engine, making it extremely easy to spot divergences in behavior. Running all engines at the same time also helps to keep the performance numbers “realistic”. In a real game you never run just the physics engine and simple graphics, you have the whole game behind, and a number of subsystems using up resources, trashing the cache, etc. Running all physics engines at the same time replicates this to some extent. In any case, it is always possible to run one engine at a time by just selecting a single one in the initial selection dialog.

Excel graphes with benchmark results can be saved by simply pressing a key. PEEL also supports simple scripts that can run desired tests and save the results automatically.

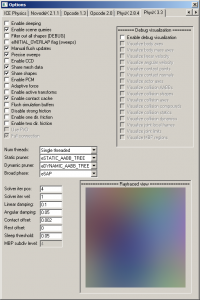
Each engine has a dedicated UI dialog for options & settings. A variety of “actions” are implemented (picking, shooting new objects, applying impulses to existing objects, etc) to let you interact with the scene and double check that things behave as expected.

—-

So, now that the stage is set, let’s see what PEEL reveals about PhysX. The following results are for PhysX 2.8.4, PhysX 3.2 and PhysX 3.3. For all these versions I just grabbed the code from their respective trunks at the time of writing. It may or may not exactly map to an officially released build of PhysX, but in any case the results should be reliable enough to give a rough idea of how the library evolved from one version to another.

I felt compelled to also include the last version of Bullet (2.81), to provide an objective external reference. The thing is, there are many people out there who still think that “PhysX is not optimized for CPU”, “PhysX does not use SIMD”, “PhysX is crippled on purpose”, and so on. So providing performance graphes for just PhysX would not prove much to them, and they could still pretend that all versions are slow anyway. Thus, adding a well-known engine like Bullet – which is often proposed as an alternative to PhysX by the same naysayers – seemed like a good reality check. (I’m talking to you, the guy who wrote “if you’re going cpu, bullet is much more optimized there“).

I have been very fair here, and recompiled the library with the same optimization flags as PhysX (in fact I even reported on the Bullet forums that the default compile options were not optimal). I also wrote PEEL’s Bullet plug-in as best as I possibly could, but admittedly I may not be a Bullet expert. So I will release the Bullet plug-in source code later, so that you can double-check if I did something wrong.

I could not include the Havok results since, well, it is forbidden to publish them according to their license. Maybe they are afraid of something here, I don’t know.

In any case, all the graphes in the following posts capture the performance of single-threaded mode. Time units are K-Cycles. Sleeping is disabled for all engines.

Realtime fracture demo using GRB

March 27th, 2013

Here’s the sequel to the previous fracture video I posted some time ago:

http://www.youtube.com/watch?v=ATU6IGCMpUA&feature=youtu.be

It’s using “GRB”, which is basically the GPU-version of PhysX.

CUDA procedural terrain

January 10th, 2013

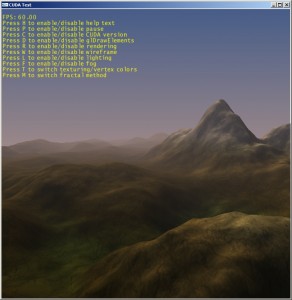
You may remember I have a thing for fractal landscapes. So here’s a CUDA “hello world” (my first CUDA test, never bothered learning it before) featuring a good old multifractal directly from Ken Musgrave’s book. Not optimized or anything, nothing special really, but damn graphics cards are fast those days (this runs @ 60 fps on my GTX 480).

Click to download.

A fractal landscape in CUDA

A fractal landscape in CUDA

Precomputed node sorting in BV-tree traversal

November 23rd, 2012

Here is another post about a small optimization I just came up with. This time the context is BV-tree traversal, for raycasts or sweeps.

So let’s say you have some raycast traversal code for an AABB-tree. If you do not do any node sorting to drive the tree traversal, your code may look like this (non-recursive version):

const AABBTreeNode* node = root;
udword Nb=1;
const AABBTreeNode* Stack[256];
Stack[0] = node;

while(Nb)
{
node = Stack[--Nb];

if(TestSegmentAABBOverlap(node))
{
if(node->IsLeaf())
{
if(TestLeaf(node))
ShrinkRay();
}
else
{
Stack[Nb++] = node->GetNeg();
Stack[Nb++] = node->GetPos();
}
}
}

This should be pretty clear. We fetch nodes from the stack, perform segment-AABB tests against the nodes’ bounding boxes.

If the node is a leaf, we test its primitive(s). In case of a hit, we reduce the length of the query segment, to reduce the total number of visited nodes.

If the node is not a leaf, we simply push its children to our stack – in reverse order so that “Pos” gets tested first -, and continue. Easy peasy.

Now this is a version without “node sorting”: we always push the 2 children to the stack in the same order, and thus we will always visit a node’s “Positive” child P before the node’s “Negative” child N. This is sometimes just fine, in particular for overlap tests where ordering does not usually matter. But for raycasts, and especially for sweeps, it is better to “sort the nodes” and make sure we visit the “closest node” first, i.e. the one that is “closer” to the ray’s origin. The reason is obvious: because we “shrink the ray” when a hit is found, if we visit the the closest node P first and shrink the ray there, the shrunk segment may not collide with N at all, and we will thus avoid visiting an entire sub-tree.

Node sorting is not strictly necessary. But it is a good way to “optimize the worst case”, and make sure the code performs adequately for all raycast directions. It has, nonetheless, an overhead, and it is likely to make the best case a little bit slower. A good read about this is the recently released thesis from Jacco Bikker, which contains a nice little code snippet to implement SIMD node sorting for packet tracing.

When dealing with simpler one-raycast-at-a-time traversals, there are usually 2 ways to implement the sorting, depending on your implementation choice for the segment-AABB test. If your segment-AABB test produces “near” and “far” distance values as a side-effect of the test, all you need to do is compare the “near” values. If however you are using a SAT-based segment-AABB, those near and far values are typically not available and an extra distance computation has to be performed. It is not necessary to use a very accurate distance test, so one option is simply to project the nodes’ centers on the ray direction, and use the resulting values. If we modify the code above to do that, we now get something like:

const AABBTreeNode* node = root;

udword Nb=1;
const AABBTreeNode* Stack[256];
Stack[0] = node;

while(Nb)
{
node = Stack[--Nb];

if(TestSegmentAABBOverlap(node))
{
if(node->IsLeaf())
{
if(TestLeaf(node))
ShrinkRay();
}
else
{
const Point& BoxCenterP = node->GetPos()->mBoxCenter;
const Point& BoxCenterN = node->GetNeg()->mBoxCenter;
if(((BoxCenterP - BoxCenterN).Dot(RayDir))<0.0f)
{
Stack[Nb++] = node->GetNeg();
Stack[Nb++] = node->GetPos();
}
else
{
Stack[Nb++] = node->GetPos();
Stack[Nb++] = node->GetNeg();
}
}
}
}

The above code could be improved, the branch could be removed, the last push to the stack could be avoided since it will otherwise probably create an LHS, etc. But this post is about node sorting, so I will only focus on this part.

It does not look like much, but it turns out that it can have a very measurable performance impact when the rest of the function is already highly optimized. It fetches the 2 children nodes (cache misses), it has a float compare (very slow on Xbox), and that dot product is annoying.

So, let’s get rid of all of these.

In order to do that, we will need to go back in time a bit. To the days of the painter’s algorithm, before Z-Buffers, when it was mandatory to render opaque polygons back-to-front. At that time even radix-sorting all triangles was considered too slow, so we often just… precomputed the sorting. We had 8 precomputed “index buffers” for 8 possible main view directions, and the whole sorting business became free. There are still various traces of those early algorithms online. This thread mentions both Iq’s version, called “Volumetric sort” and the similar article I wrote some 10 years before that. That was back in 1995, so the idea itself is nothing new.

What is new however, I think, is applying the same strategy to BV-tree traversals. I did not see this before.

So there are 8 possible main view directions. For each of them, and for each node, we need to precompute the closest child. Since we have only 2 nodes in the binary tree, we need only one bit to determine which one is closest, and thus we need 8 bits per node to encode the precomputed sorting. That’s the memory overhead for the technique, and it may or may not be acceptable to you depending on how easy it is to squeeze one more byte in your nodes.

The precomputation part is trivial. A vanilla non-optimized version could look like the following, performed on each node after the tree has been built:

static bool gPrecomputeSort(AABBTreeNode* node)
{
if(node->IsLeaf())
return true;
const AABBTreeNode* P = node->GetPos();
const AABBTreeNode* N = node->GetNeg();
const Point& C0 = P->mBoxCenter;
const Point& C1 = N->mBoxCenter;

Point DirPPP(1.0f, 1.0f, 1.0f); DirPPP.Normalize();
Point DirPPN(1.0f, 1.0f, -1.0f); DirPPN.Normalize();
Point DirPNP(1.0f, -1.0f, 1.0f); DirPNP.Normalize();
Point DirPNN(1.0f, -1.0f, -1.0f); DirPNN.Normalize();
Point DirNPP(-1.0f, 1.0f, 1.0f); DirNPP.Normalize();
Point DirNPN(-1.0f, 1.0f, -1.0f); DirNPN.Normalize();
Point DirNNP(-1.0f, -1.0f, 1.0f); DirNNP.Normalize();
Point DirNNN(-1.0f, -1.0f, -1.0f); DirNNN.Normalize();

const bool bPPP = ((C0 - C1).Dot(DirPPP))<0.0f;
const bool bPPN = ((C0 - C1).Dot(DirPPN))<0.0f;
const bool bPNP = ((C0 - C1).Dot(DirPNP))<0.0f;
const bool bPNN = ((C0 - C1).Dot(DirPNN))<0.0f;
const bool bNPP = ((C0 - C1).Dot(DirNPP))<0.0f;
const bool bNPN = ((C0 - C1).Dot(DirNPN))<0.0f;
const bool bNNP = ((C0 - C1).Dot(DirNNP))<0.0f;
const bool bNNN = ((C0 - C1).Dot(DirNNN))<0.0f;

udword Code = 0;
if(!bPPP)
Code |= (1<<7); // Bit 0: PPP
if(!bPPN)
Code |= (1<<6); // Bit 1: PPN
if(!bPNP)
Code |= (1<<5); // Bit 2: PNP
if(!bPNN)
Code |= (1<<4); // Bit 3: PNN
if(!bNPP)
Code |= (1<<3); // Bit 4: NPP
if(!bNPN)
Code |= (1<<2); // Bit 5: NPN
if(!bNNP)
Code |= (1<<1); // Bit 6: NNP
if(!bNNN)
Code |= (1<<0); // Bit 7: NNN

node->mCode = Code;
return true;
}

Then the traversal code simply becomes:

const AABBTreeNode* node = root;

udword Nb=1;
const AABBTreeNode* Stack[256];
Stack[0] = node;

const udword DirMask = ComputeDirMask(RayDir);

while(Nb)
{
node = Stack[--Nb];

if(TestSegmentAABBOverlap(node))
{
if(node->IsLeaf())
{
if(TestLeaf(node))
ShrinkRay();
}
else
{
if(node->mCode & DirMask)
{
Stack[Nb++] = node->GetNeg();
Stack[Nb++] = node->GetPos();
}
else
{
Stack[Nb++] = node->GetPos();
Stack[Nb++] = node->GetNeg();
}
}
}
}

As you can see, all the bad bits are gone, and node sorting is now a single AND. The “direction mask” is precomputed once before the traversal starts, so its overhead is completely negligible. An implementation could be:

//! Integer representation of a floating-point value.
#define IR(x) ((udword&)(x))

static udword ComputeDirMask(const Point& dir)
{
const udword X = IR(dir.x)>>31;
const udword Y = IR(dir.y)>>31;
const udword Z = IR(dir.z)>>31;
const udword BitIndex = Z|(Y<<1)|(X<<2);
return 1<<BitIndex;
}

And that’s it. Gains vary from one scene to another and especially from one platform to another, but this is another useful trick in our quest to “speed of light” BV-tree traversals.

Restrict this

November 20th, 2012

A quick post about a little-known feature of the “restrict” keyword…

I assume you all know about “restrict” already, but if not, let’s start with a simple example of what it’s useful for.

Say we have a function in some class looking like this:

class RTest
{
public:
RTest() : mMember(0)    {}

void DoStuff(int nb, int* target);

int mMember;
};

void RTest::DoStuff(int nb, int* target)
{
while(nb–)
{
*target++ = mMember;
mMember++;
}
}

Looking at the disassembly in Release mode, you get something like the following (the isolated block in the middle is the loop):

00E9EEA0  mov         eax,dword ptr [esp+4]
00E9EEA4  test        eax,eax
00E9EEA6  je          RTest::DoStuff+1Fh (0E9EEBFh)
00E9EEA8  mov         edx,dword ptr [esp+8]
00E9EEAC  push        esi
00E9EEAD  lea         ecx,[ecx]

00E9EEB0 mov         esi,dword ptr [ecx] // Load mMember
00E9EEB2  mov         dword ptr [edx],esi // *target = mMember
00E9EEB4 inc         dword ptr [ecx] // mMember++
00E9EEB6  dec         eax
00E9EEB7  add         edx,4 // target++
00E9EEBA  test        eax,eax
00E9EEBC  jne         RTest::DoStuff+10h (0E9EEB0h)

00E9EEBE  pop         esi
00E9EEBF  ret         8

So as you can see, there is a read-modify-write operation on mMember each time, and then mMember is reloaded once again to write it to the target buffer. This is not very efficient. Loads & writes to memory are slower than loads & writes to registers for example. But more importantly, this creates a lot of LHS since we clearly load what we just wrote. On a platform like the Xbox, where an LHS is a ~60 cycles penalty on average, this is a killer. Generally speaking, any piece of code doing “mMember++” is a potential LHS, and something to keep an eye on.

There are various ways to do better than that. One way would be to simply rewrite the code so that mMember is explicitly kept in a local variable:

void RTest::DoStuffLocal(int nb, int* target)
{
int local = mMember;
while(nb–)
{
*target++ = local;
local++;
}
mMember = local;
}

This produces the following disassembly:

010AEED0  mov         edx,dword ptr [esp+4]
010AEED4 mov         eax,dword ptr [ecx] // Load mMember
010AEED6  test        edx,edx
010AEED8  je          RTest::DoStuffLocal+1Ch (10AEEECh)
010AEEDA  push        esi
010AEEDB  mov         esi,dword ptr [esp+0Ch]
010AEEDF nop

010AEEE0  mov         dword ptr [esi],eax // *target = mMember
010AEEE2  dec         edx
010AEEE3  add         esi,4 // target++
010AEEE6 inc         eax // mMember++
010AEEE7  test        edx,edx
010AEEE9  jne         RTest::DoStuffLocal+10h (10AEEE0h)

010AEEEB  pop         esi
010AEEEC mov         dword ptr [ecx],eax // Store mMember
010AEEEE  ret         8

This is pretty much what you expect from the source code: you see that the load has been moved outside of the loop, our local variable has been mapped to the eax register, the LHS are gone, and mMember is properly updated only once, after the loop has ended.

Note that the compiler inserted a nop just before the loop. This is simply because loops should be aligned to 16-bytes boundaries to be the most efficient.

Another way to achieve the same result without modifying the main code is to use the restrict keyword. Just mark the target pointer as restricted, like this:

void RTest::DoStuffRestricted(int nb, int* __restrict target)
{
while(nb–)
{
*target++ = mMember;
mMember++;
}
}

This produces the following disassembly:

010AEF00  mov         edx,dword ptr [esp+4]
010AEF04  test        edx,edx
010AEF06  je          RTest::DoStuffRestricted+1Eh (10AEF1Eh)
010AEF08 mov         eax,dword ptr [ecx] // Load mMember
010AEF0A  push        esi
010AEF0B  mov         esi,dword ptr [esp+0Ch]
010AEF0F  nop

010AEF10  mov         dword ptr [esi],eax // *target = mMember
010AEF12  dec         edx
010AEF13  add         esi,4 // target++
010AEF16 inc         eax // mMember++
010AEF17  test        edx,edx
010AEF19  jne         RTest::DoStuffRestricted+10h (10AEF10h)

010AEF1B mov         dword ptr [ecx],eax // Store mMember
010AEF1D  pop         esi
010AEF1E  ret         8

In other words, this is almost exactly the same disassembly as for the solution using the local variable - but without the need to actually modify the main source code.

What happened here should not be a surprise: without __restrict, the compiler had no way to know that the target pointer was not potentially pointing to mMember itself. So it had to assume the worst and generate “safe” code that would work even in that unlikely scenario. Using __restrict however, told the compiler that the memory pointed to by “target” was accessed through that pointer only (and pointers copied from it). In particular, it promised the compiler that “this”, the implicit pointer from the RTest class, could not point to the same memory as “target”. And thus, it is now safe to keep mMember in a register for the duration of the loop.

So far, so good. This is pretty much a textbook example of how to use __restrict and what it is useful for. The only important point until now, really, is this: as you can see from the disassembly, __restrict has a clear, real impact on generated code. Just in case you had any doubts…

Now the reason for this post is something more subtle than this: how do we “restrict this”? How do we restrict the implicit “this” pointer from C++ ?

Consider the following, modified example, where our target pointer is now a class member:

class RTest
{
public:
RTest() : mMember(0), mTarget(0) {}

int DoStuffClassMember(int nb);

int mMember;
int*  mTarget;
};

int RTest::DoStuffClassMember(int nb)
{
while(nb–)
{
*mTarget++ = mMember;
mMember++;
}
return mMember;
}

Suddenly we can’t easily mark the target pointer as restricted anymore, and the generated code looks pretty bad:

0141EF60  mov         eax,dword ptr [esp+4]
0141EF64  test        eax,eax
0141EF66  je          RTest::DoStuffClassMember+23h (141EF83h)
0141EF68  push        esi
0141EF69  mov         edx,4
0141EF6E  push        edi
0141EF6F  nop

0141EF70  mov         esi,dword ptr [ecx+4] // mTarget
0141EF73  mov         edi,dword ptr [ecx] // mMember
0141EF75  mov         dword ptr [esi],edi // *mTarget = mMember;
0141EF77  add         dword ptr [ecx+4],edx // mTarget++
0141EF7A  inc         dword ptr [ecx] // mMember++
0141EF7C  dec         eax
0141EF7D  test        eax,eax
0141EF7F  jne         RTest::DoStuffClassMember+10h (141EF70h)

0141EF81  pop         edi
0141EF82  pop         esi
0141EF83  mov         eax,dword ptr [ecx]
0141EF85  ret         4

That’s pretty much as bad as it gets: 2 loads, 2 read-modify-writes, 2 LHS for each iteration of that loop. This is what Christer Ericson refers to as the “C++ abstraction penalty”: generally speaking, accessing class members within loops is a very bad idea. It is usually much better to load those class member to local variables before the loop starts, or pass them to the function as external parameters.

As we saw in the previous example, an alternative would be to mark the target pointer as restricted. In this particular case though, it seems difficult to do since the pointer is a class member. But let’s try this anyway, since it compiles:

class RTest
{
public:
RTest() : mMember(0), mTarget(0)   {}

int DoStuffClassMember(int nb);

int mMember;
int__restrict mTarget;
};

Generated code is:

00A8EF60  mov         eax,dword ptr [esp+4]
00A8EF64  test        eax,eax
00A8EF66  je          RTest::DoStuffClassMember+23h (0A8EF83h)
00A8EF68  push        esi
00A8EF69  mov         edx,4
00A8EF6E  push        edi
00A8EF6F  nop

00A8EF70  mov         esi,dword ptr [ecx+4]
00A8EF73  mov         edi,dword ptr [ecx]
00A8EF75  mov         dword ptr [esi],edi
00A8EF77  add         dword ptr [ecx+4],edx
00A8EF7A  inc         dword ptr [ecx]
00A8EF7C  dec         eax
00A8EF7D  test        eax,eax
00A8EF7F  jne         RTest::DoStuffClassMember+10h (0A8EF70h)

00A8EF81  pop         edi
00A8EF82  pop         esi
00A8EF83  mov         eax,dword ptr [ecx]
00A8EF85  ret         4

Nope, didn’t work, this is exactly the same code as before.

What we really want here is to mark “this” as restricted, since “this” is the pointer we use to access both mTarget and mMember. With that goal in mind, a natural thing to try is, well, exactly that:

int RTest::DoStuffClassMember(int nb)
{
RTest* __restrict RThis = this;
while(nb–)
{
*RThis->mTarget++ = RThis->mMember;
RThis->mMember++;
}
return RThis->mMember;
}

This produces the following code:

0114EF60  push        esi
0114EF61  mov         esi,dword ptr [esp+8]
0114EF65  test        esi,esi
0114EF67  je          RTest::DoStuffClassMember+26h (114EF86h)
0114EF69 mov         edx,dword ptr [ecx] // mMember
0114EF6B mov         eax,dword ptr [ecx+4] // mTarget
0114EF6E  mov         edi,edi

0114EF70  mov         dword ptr [eax],edx // *mTarget = mMember
0114EF72  dec         esi
0114EF73 add         eax,4 // mTarget++
0114EF76 inc         edx // mMember++
0114EF77  test        esi,esi
0114EF79  jne         RTest::DoStuffClassMember+10h (114EF70h)

0114EF7B mov         dword ptr [ecx+4],eax // Store mTarget
0114EF7E mov         dword ptr [ecx],edx // Store mMember
0114EF80  mov         eax,edx
0114EF82  pop         esi
0114EF83  ret         4
0114EF86  mov         eax,dword ptr [ecx]
0114EF88  pop         esi
0114EF89  ret         4

It actually works! Going through a restricted this, despite the unusual and curious syntax, does solve all the problems from the original code. Both mMember and mTarget are loaded into registers, kept there for the duration of the loop, and stored back only once in the end.

Pretty cool.

If we ignore the horrible syntax, that is. Imagine a whole codebase full of “RThis->mMember++;”, this wouldn’t be very nice.

There is actually another way to “restrict this”. I thought it only worked with GCC, but this is not true. The following syntax actually compiles and does the expected job with Visual Studio as well. Just mark the function itself as restricted:

class RTest
{
public:
RTest() : mMember(0), mTarget(0)   {}

int DoStuffClassMember(int nb)   __restrict;

int mMember;
int*  mTarget;
};

int RTest::DoStuffClassMember(int nb)    __restrict
{
while(nb–)
{
*mTarget++ = mMember;
mMember++;
}
return mMember;
}

This generates exactly the same code as with our fake “this” pointer:

0140EF60  push        esi
0140EF61  mov         esi,dword ptr [esp+8]
0140EF65  test        esi,esi
0140EF67  je          RTest::DoStuffClassMember+26h (140EF86h)
0140EF69  mov         edx,dword ptr [ecx]
0140EF6B  mov         eax,dword ptr [ecx+4]
0140EF6E mov         edi,edi

0140EF70  mov         dword ptr [eax],edx
0140EF72  dec         esi
0140EF73  add         eax,4
0140EF76  inc         edx
0140EF77  test        esi,esi
0140EF79  jne         RTest::DoStuffClassMember+10h (140EF70h)

0140EF7B  mov         dword ptr [ecx+4],eax
0140EF7E  mov         dword ptr [ecx],edx
0140EF80  mov         eax,edx
0140EF82  pop         esi
0140EF83  ret         4
0140EF86  mov         eax,dword ptr [ecx]
0140EF88  pop         esi
0140EF89  ret         4

This is the official way to “restrict this”, and until recently I didn’t know it worked in Visual Studio. Yay!

A few closing comments about the above code…. Astute readers would have noticed a few things that I didn’t mention yet:

The curious “mov edi, edi” clearly doesn’t do anything, and it would be easy to blame the compiler here for being stupid. Well, the compiler is stupid and does generate plenty of foolish things, but this is not one of them. Notice how it happens right before the loop starts? This is the equivalent of the “nop” we previously saw. The reason why the compiler chose not to use nops here is because nop takes only 1 byte (its opcode is “90”), so we would have needed 2 of them here to align the loop to 16-bytes. Using a useless 2-bytes instruction achieves the same goal, but with a single instruction.

Finally, note that the main loop actually touches 3 registers instead of 2:

  • esi, the loop counter (nb–)
  • eax, the target address mTarget
  • edx, the data member mMember

This is not optimal, there is no need to touch the loop counter there. It would probably have been more efficient to store the edx limit within esi, something like:

add        esi, edx                // esi = loop limit
Loop :
mov       dword ptr [eax], edx
add        eax, 4
inc          edx
cmp       edx, esi
jne         Loop

This moves all ‘dec esi’ operations out of the loop, which might have been a better strategy. Oh well. Maybe the compiler is stupid after all :)

In Time

July 16th, 2012

I recently watched “In Time“, that sci-fi movie with Justin Timberlake. The main concept in that movie is that time is the new currency: you don’t pay with money or gold, you pay with a little bit of your lifetime. And I immediately thought, “wait a minute… this reminds me of something…”

I knew exactly when and where I had seen that before: in Mandrake. When I was a kid. In Le Journal de Mickey. Believe it or not, they had exactly the same concept there, in that short story published in 1982.

A trip to my mother’s place and a quick search in the basement revealed the following pages (click on them for larger versions). I have been completely unable to find a trace of this story online - if somebody knows its name or when and where it’s been originally published, please tell me.


shopfr.org cialis